Market Outlook
January 04, 2017
Market Cues
Domestic Indices
Chg (%)
(Pts)
(Close)
Indian markets are likely to open flat with a positive bias tracking SGX Nifty and
BSE Sensex
0.2
48
26,643
global cues.
Nifty
0.2
13
8,192
After a long holiday period the US markets opened on strong note on Tuesday and
Mid Cap
0.6
74
12,205
moved up sharply. While major indices came off from days high they closed with a
Small Cap
1.0
125
12,315
positive note for the day. A positive economic data by Institute for Supply
Bankex
0.5
113
20,616
Management showed that PMI for December increased to 54.7 from
53.2%,
showing strength in the economy and this could have helped the sentiment.
Global Indices
Chg (%)
(Pts)
(Close)
Most of the European markets also ended on a positive note on the back of positive
economic data from UK. Further positive data points both from US and China also
Dow Jones
0.6
119
19,882
played a role in yesterday’s trade.
Nasdaq
0.9
46
5,429
FTSE
0.5
35
7,178
Indian markets traded in a narrow range on Tuesday. While banking stocks which
Nikkei
(0.2)
(31)
19,114
had been weak in the previous trading session saw some buying interest, on the
other hand oil marketing companies recovered on the news of hikes in petrol and
Hang Seng
0.7
150
22,150
diesel prices.
Shanghai Com
1.0
32
3,136
News Analysis
Advances / Declines
BSE
NSE
HDFC cuts home loan rates by upto 0.45%
Advances
1,859
1,156,
Govt Raises ` 21,400cr so far in FY17 via stake sale
Detailed analysis on Pg2
Declines
910
470
Unchanged
134
68
Investor’s Ready Reckoner
Key Domestic & Global Indicators
Volumes (` Cr)
Stock Watch: Latest investment recommendations on 150+ stocks
BSE
2,621
Refer Pg5 onwards
NSE
15,711
Top Picks
CMP
Target
Upside
Company
Sector
Rating
Net Inflows (` Cr)
Net
Mtd
Ytd
(`)
(`)
(%)
Amara Raja Batteries Auto & Auto Ancillary
Buy
890
1,167
31.1
FII
(500)
(8,995)
18,283
Alkem Laboratories
Pharmaceuticals
Buy
1,655
1,989
20.2
MFs
562
6,986
45,171
HCL Tech
IT
Buy
835
1,000
19.8
Power Grid Corp.
Power
Buy
188
223
18.6
Top Gainers
Price (`)
Chg (%)
Navkar Corp.
Others
Buy
170
265
55.6
Sintex
81
7.7
More Top Picks on Pg4
Il&Fstrans
111
7.6
Key Upcoming Events
Ioc
346
5.8
Previous
Consensus
Date
Region
Event Description
Emamiltd
1,026
5.7
Reading
Expectations
Jan 04 US
Initial Jobless claims
265.0
260.0
Manappuram
73
5.2
Jan 05 Germany
PMI Manufacturing
53.8
53.8
Jan 06 Euro Zone
Euro Zone Consumer Confidence
(5.1)
(5.3)
Top Losers
Price (`)
Chg (%)
Jan 06 China
Consumer price Index (YoY)
2.3
2.3
Shreecem
14,115
(2.7)
More Events on Pg4
Mphasis
542
(2.7)
Bhartiartl
304
(2.4)
Ibulhsgfin
663
(2.4)
Hindcopper
62
(2.4)
As on January 03, 2017
Market Outlook
January 04, 2017
News Analysis
HDFC Cuts home loan rates by upto 0.45%
India’s largest mortgage lender HDFC Ltd has reduced its lending rates by as
much as 45 bps to match the rates of large banks like SBI. In one of the steepest
rate cuts SBI on Sunday gad gone for a steep 90 bps cut in its MCLR based lending
rates and effectively home loans rates were reduced by 35-50 bps. With banks
across the board receiving huge inflows of deposits the cost of funds has come
down for them. HFCs borrow both from banks and through money market
instruments and as the cost of funds for them has also come down and in order to
match the competition they had reduce the rates.
HDFC had reported a 15.7% growth in its loan book in Q2FY17 to ` 2.75lakh
crores. While its income from operations had grown by 9.6% YoY to ` 8063cr, its
PAT had grown by 13.8% during the same period. While loan growth in the
medium term is likely to pick up due to lower rates, a fall in property prices would
make it more affordable for buyers. HDFC Ltd being the largest lender will benefit
out of this. However, due to rich valuations we have a NEUTRAL rating on the
stock.
Govt Raises ` 21,400cr via stake sale so far in FY17
The Government has so far raised over ` 21,432cr via selling its stakes in various
Public sector undertakings. The Government has kept a target of raising `
56,500cr this year, comprising of ` 36,000cr from disinvestments of Central Public
Sector Enterprises and ` 20,500cr from strategic disinvestment. Accordingly the
amount raise via stake sales in CPSEs amounts to ~60% of the targeted figure by
the Govt. As the figure is considered till April-November-2016, it seems the Govt
can go ahead with the stake sales in the CPSEs and meet the desired figure. In the
previous financial year the Govt was not able to meet its disinvestment target.
While it had kept an ambitious target of ` 69,500cr the actual sum raised was only
to the tune of ` 25,312cr. However, with buoyant capital markets and investors’
appetite for quality PSUs the Govt seems will be able to meet its target this
financial year.
Economic and Political News
Paytm secures final nod to set up payment banks
SC seeks list of corporate with outstanding loan beyond ` 500cr
BSE gets SEBI clearance for IPO
Infrastructure projects to get rating system soon
Corporate News
HDFC and Indiabulls Housing Finance Ltd have cut retail home rates by 40-
45 bps points
Airtel to offer free 4G data for a year to those who switch
CIL to start 2nd phase of coal linkage auction this month
Market Outlook
January 04, 2017
Top Picks
Large Cap
M
arket Cap
CM
P
T
arget
Upsid
e
Company
Rationale
(` Cr)
(`)
(`)
(%)
To outpace battery industry growth due to better
Amara Raja Batteries
15,206
890
1,167
31.1
technological products leading to market share gains in both
the automotive OEM and replacement segments.
Strong growth in domestic business due to its leadership in
Alkem Laboratories
19,790
1,655
1,989
20.2
acute therapeutic segment. Alkem expects to launch more
products in USA, which bodes for its international business.
The stock is trading at attractive valuations and is factoring all
HCL Tech
1,17,832
835
1,000
19.8
the bad news.
Back on the growth trend, expect a long term growth of 14%
Infosys
2,28,466
995
1,249
25.5
to be a US$20bn in FY2020.
Strong order backlog and improvement in execution would
Larsen & Tourbo
1,27,590
1,368
1,634
19.4
trigger the growth for the L&T
One of the largest pharma companies with strong
Lupin
67,975
1,506
1,809
20.1
international presence. It has a rich pipeline of ANDAs which
is also one of the largest among the generic companies.
Going forward, we expect the company to report strong top-
Power Grid Corporation
98,354
188
223
18.6
line CAGR of ~16% and bottom-line CAGR of ~19% over
FY16-18 on back of strong capitalization guidance
Source: Company, Angel Research
Mid Cap
M
arket Cap
CM
P
T
arget
Upsid
e
Company
Rationale
(` Cr)
(`)
(`)
(%)
We expect the company would report strong profitability
Asian Granito
690
229
351
53.1
owing to better product mix, higher B2C sales and
amalgamation synergy.
Among the top 4 players in the consumer durables segment.
Bajaj Electricals
2,289
226
274
21.0
Improved profitability backed by turn around in E&P segment.
Strong order book lends earnings visibility.
Favourable outlook for the AC industry to augur well for
Cooling products business which is out pacing the market
Blue Star
4,669
489
634
29.7
growth. EMPPAC division's profitability to improve once
operating environment turns around.
With a focus on the low and medium income (LMI) consumer
Dewan Housing Finance
7,697
246
350
42.4
segment, the company has increased its presence in tier-II &
III cities where the growth opportunity is immense.
Strong loan growth backed by diversified loan portfolio and
Equitas Holdings
5,009
149
235
57.3
adequate CAR. ROE & ROA likely to remain decent as risk of
dilution remains low. Attractive valuations considering growth.
Economic recovery to have favourable impact on advertising
& circulation revenue growth. Further, the acquisition of a
Jagran Prakashan
5,894
180
225
24.8
radio business (Radio City) would also boost the company's
revenue growth.
Speedier execution and speedier sales, strong revenue visibilty
Mahindra Lifespace
1,468
358
522
45.9
in short-to-long run, attractive valuations
We expect the company to report strong growth on back of
healthy growth in domestic branded sales (owing to
Mirza International
1,076
89
107
19.7
aggressive ad spend and addition in the number of EBOs &
multi-brand outlets [MBOs]) and healthy export revenues.
Massive capacity expansion along with rail advantage at ICD
Navkar Corporation
2,429
170
265
55.6
as well CFS augurs well for the company
Strong brands and distribution network would boost growth
Siyaram Silk Mills
1,241
1,324
1,605
21.3
going ahead. Stock currently trades at an inexpensive
valuation.
Market leadership in Hindi news genre and no. 2 viewership
ranking in English news genre, exit from the radio business,
TV Today Network
1,717
288
385
33.8
and anticipated growth in ad spends by corporates to benefit
the stock.
Source: Company, Angel Research
Market Outlook
January 04, 2017
Key Upcoming Events
Global economic events release calendar
Date
Time
Country
Event Description
Unit
Period
Bloomberg Data
Last Reported Estimated
Jan 4, 2017
7:00PM
US
Initial Jobless claims
Thousands
Dec 31
265.00
260.00
Jan 5, 2017
2:25PM
Germany
PMI Services
Value
Dec F
53.80
53.80
Jan 6, 2017
3:30PM
Euro Zone
Euro-Zone Consumer Confidence
Value
Dec F
(5.10)
(5.30)
7:00AM
China
Consumer Price Index (YoY)
% Change
Dec
2.30
2.30
7:00PM
US
Change in Nonfarm payrolls
Thousands
Dec
178.00
178.00
Jan 10, 2017
7:00PM
US
Unnemployment rate
%
Dec
4.60
4.70
India
Imports YoY%
% Change
Dec
10.40
--
India
Exports YoY%
% Change
Dec
2.30
--
Jan 11, 2017
3:00PM
UK
Industrial Production (YoY)
% Change
Nov
(1.10)
--
Jan 12, 2017
5:30PM
India
Industrial Production YoY
% Change
Nov
(1.90)
--
Jan 13, 2017
China
Exports YoY%
% Change
Dec
(1.60)
(3.00)
US
Producer Price Index (mom)
% Change
Dec
--
--
Jan 16, 2017
12:00PM
India
Monthly Wholesale Prices YoY%
% Change
Dec
3.15
--
Jan 17, 2017
3:00PM
UK
CPI (YoY)
% Change
Dec
1.20
--
Jan 18, 2017
7:00PM
US
Consumer price index (mom)
% Change
Dec
0.20
--
3:00PM
UK
Jobless claims change
% Change
Dec
2.40
--
3:30PM
Euro Zone
Euro-Zone CPI (YoY)
%
Dec F
0.60
--
7:45PM
US
Industrial Production
%
Dec
(0.44)
--
Jan 19, 2017
7:00PM
US
Housing Starts
Thousands
Dec
1,090.00
--
7:00PM
US
Building permits
Thousands
Dec
1,212.00
--
6:15PM
Euro Zone
ECB announces interest rates
%
Jan 19
--
--
Jan 20, 2017
7:30AM
China
Industrial Production (YoY)
% Change
Dec
6.20
--
7:30AM
China
Real GDP (YoY)
% Change
4Q
6.70
--
Jan 24, 2017
8:30PM
US
Existing home sales
Million
Dec
5.61
--
2:00PM
Germany
PMI Manufacturing
Value
Jan P
55.60
--
Jan 26, 2017
8:30PM
US
New home sales
Thousands
Dec
592.00
--
7:00PM
US
GDP Qoq (Annualised)
% Change
4Q A
3.50
--
Source: Bloomberg, Angel Research
Market Outlook
January 04, 2017
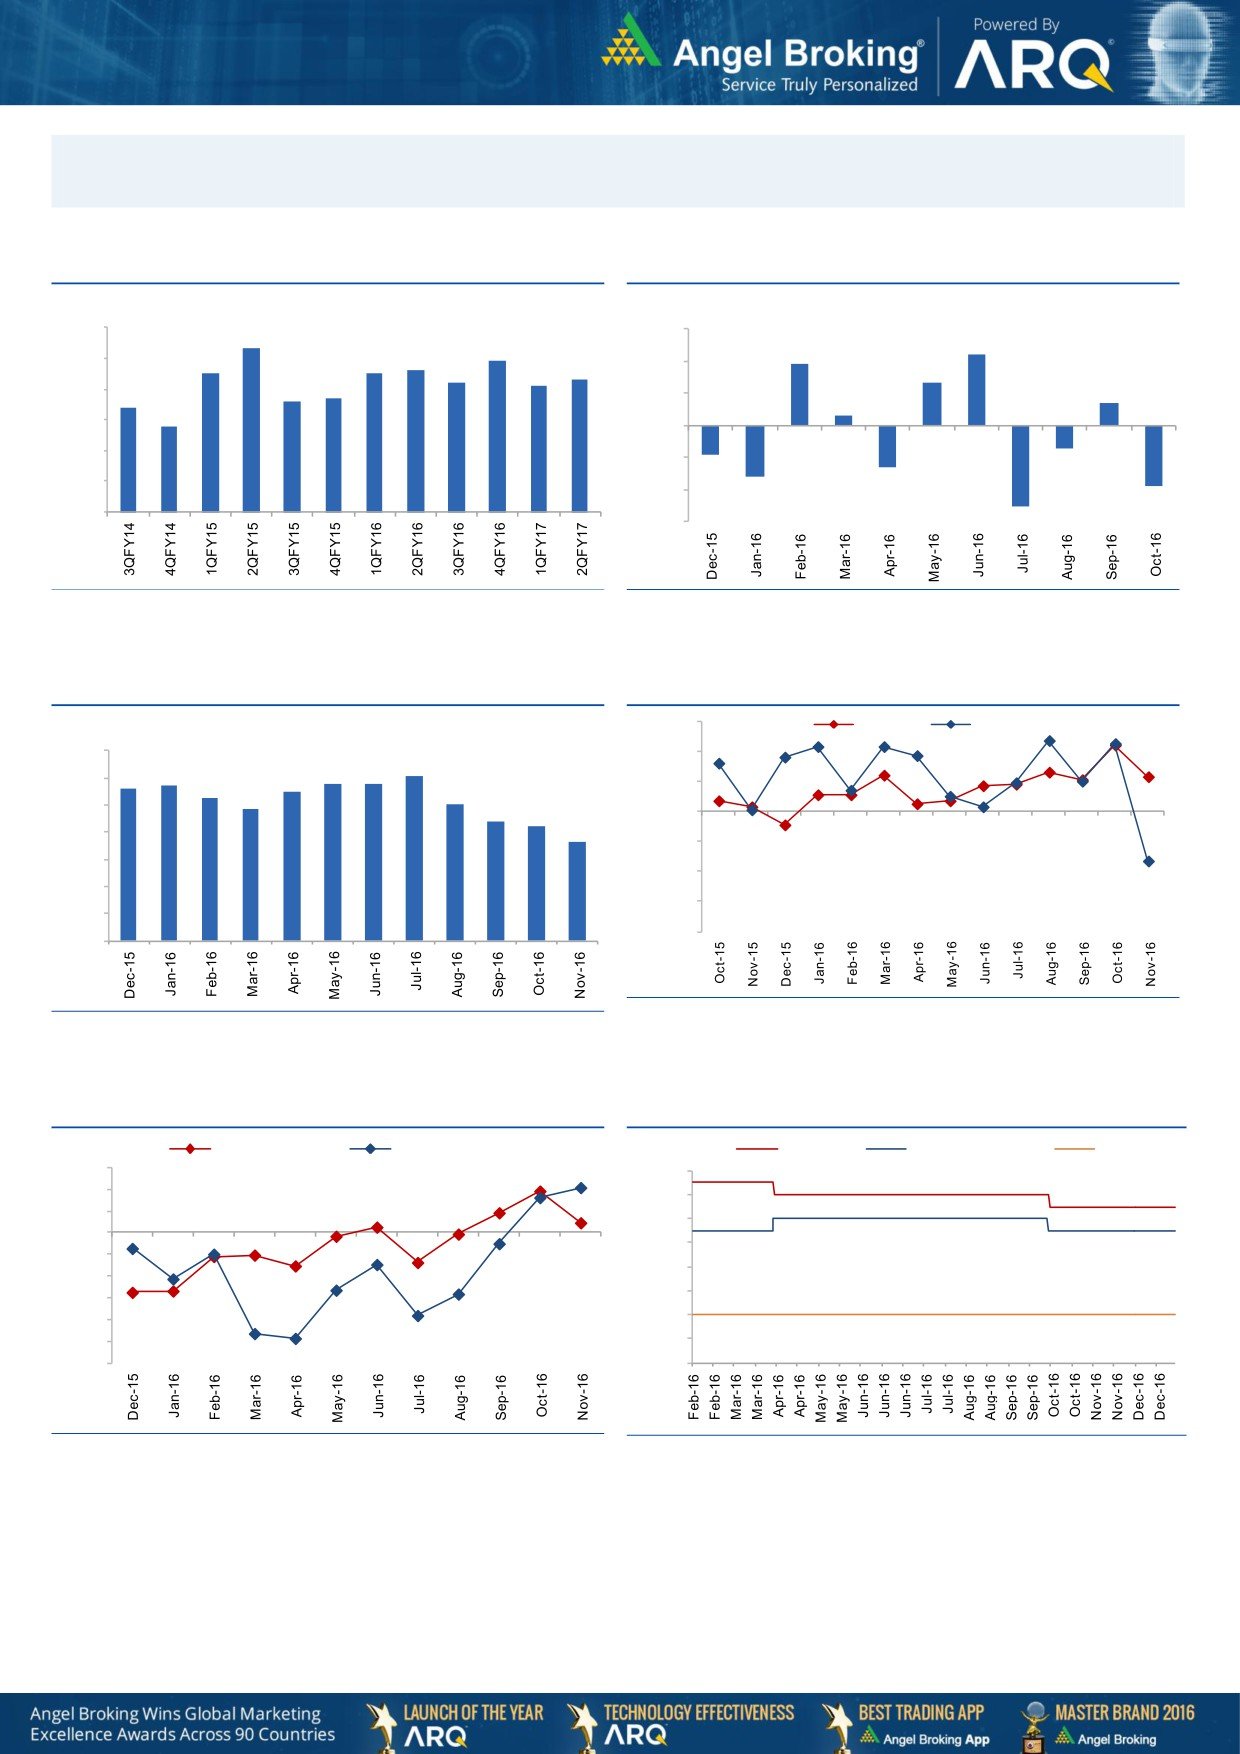
Macro watch
Exhibit 1: Quarterly GDP trends
Exhibit 2: IIP trends
(%)
(%)
9.0
8.3
3.0
2.2
7.9
1.9
7.5
7.5
7.6
8.0
7.3
2.0
7.2
7.1
1.3
6.6
6.7
0.7
7.0
6.4
1.0
0.3
5.8
6.0
-
5.0
(1.0)
(0.7)
(0.9)
4.0
(1.3)
(2.0)
(1.6)
(1.9)
3.0
(3.0)
(2.5)
Source: CSO, Angel Research
Source: MOSPI, Angel Research
Exhibit 3: Monthly CPI inflation trends
Exhibit 4: Manufacturing and services PMI
56.0
Mfg. PMI
Services PMI
(%)
7.0
54.0
6.1
5.6
5.7
5.8
5.8
6.0
5.3
5.5
52.0
5.1
4.8
5.0
4.4
4.2
50.0
3.6
4.0
48.0
3.0
46.0
2.0
44.0
1.0
42.0
-
Source: Market, Angel Research; Note: Level above 50 indicates expansion
Source: MOSPI, Angel Research
Exhibit 5: Exports and imports growth trends
Exhibit 6: Key policy rates
(%)
Exports yoy growth
Imports yoy growth
(%)
Repo rate
Reverse Repo rate
CRR
15.0
7.00
10.0
6.50
5.0
6.00
0.0
5.50
(5.0)
5.00
(10.0)
4.50
(15.0)
(20.0)
4.00
(25.0)
3.50
(30.0)
3.00
Source: Bloomberg, Angel Research
Source: RBI, Angel Research
Stock Watch
January 04, 2017
Company Name
Reco
CMP
Target
Mkt Cap
Sales ( Čcr )
OPM(%)
EPS (Č)
PER(x)
P/BV(x)
RoE(%)
EV/Sales(x)
(Č)
Price ( Č)
( Č cr )
FY17E FY18E
FY17E
FY18E
FY17E
FY18E
FY17E
FY18E
FY17E
FY18E
FY17E
FY18E
FY17E
FY18E
Agri / Agri Chemical
Rallis
Neutral
205
-
3,991
1,937
2,164
13.3
14.3
9.0
11.0
22.8
18.7
4.0
3.5
18.4
19.8
2.1
1.8
United Phosphorus
Neutral
655
-
33,208
15,176
17,604
18.5
18.5
37.4
44.6
17.5
14.7
3.4
2.8
21.4
21.2
2.3
1.9
Auto & Auto Ancillary
Ashok Leyland
Buy
81
111
23,080
22,407
26,022
10.6
10.6
5.2
6.4
15.6
12.6
3.5
3.0
23.6
24.7
1.1
0.9
Bajaj Auto
Neutral
2,620
-
75,817
25,093
27,891
19.5
19.2
143.9
162.5
18.2
16.1
5.1
4.4
30.3
29.4
2.7
2.4
Bharat Forge
Neutral
923
-
21,489
7,726
8,713
20.5
21.2
35.3
42.7
26.2
21.6
4.8
4.4
18.9
20.1
2.8
2.5
Eicher Motors
Neutral
22,501
-
61,210
16,583
20,447
17.5
18.0
598.0
745.2
37.6
30.2
12.9
9.8
41.2
38.3
3.5
2.8
Gabriel India
Buy
109
130
1,570
1,544
1,715
9.0
9.3
5.4
6.3
20.2
17.4
3.8
3.4
18.9
19.5
1.0
0.9
Hero Motocorp
Buy
2,987
3,541
59,655
30,958
34,139
15.7
15.7
193.6
208.3
15.4
14.3
6.0
5.0
34.2
30.5
1.8
1.6
Jamna Auto Industries Neutral
179
-
1,429
1,486
1,620
9.8
9.9
15.0
17.2
12.0
10.4
2.6
2.2
21.8
21.3
1.0
0.9
L G Balakrishnan & Bros Neutral
575
-
902
1,302
1,432
11.6
11.9
43.7
53.0
13.2
10.9
1.9
1.7
13.8
14.2
0.8
0.7
Mahindra and Mahindra Neutral
1,223
-
75,972
46,534
53,077
11.6
11.7
67.3
78.1
18.2
15.7
3.0
2.6
15.4
15.8
1.6
1.4
Maruti
Accumulate
5,510
6,006
166,455
68,057
82,958
15.8
15.5
212.1
261.2
26.0
21.1
5.2
4.3
19.8
20.3
2.1
1.7
Minda Industries
Neutral
317
-
2,515
2,728
3,042
9.0
9.1
68.2
86.2
4.7
3.7
1.1
0.8
23.8
24.3
1.0
0.8
Motherson Sumi
Neutral
323
-
45,351
45,896
53,687
7.8
8.3
13.0
16.1
24.8
20.1
8.0
6.4
34.7
35.4
1.1
0.9
Rane Brake Lining
Neutral
1,002
-
793
511
562
11.3
11.5
28.1
30.9
35.7
32.4
5.4
4.9
15.3
15.0
1.7
1.5
Setco Automotive
Neutral
38
-
506
741
837
13.0
13.0
15.2
17.0
2.5
2.2
0.4
0.4
15.8
16.3
1.1
1.0
Tata Motors
Neutral
481
-
138,947
300,209
338,549
8.9
8.4
42.7
54.3
11.3
8.9
1.8
1.5
15.6
17.2
0.6
0.5
TVS Motor
Neutral
377
-
17,930
13,390
15,948
6.9
7.1
12.8
16.5
29.6
22.8
7.4
5.8
26.3
27.2
1.3
1.1
Amara Raja Batteries
Buy
890
1,167
15,206
5,504
6,605
17.6
17.5
33.4
40.9
26.7
21.8
5.9
4.8
22.1
22.0
2.8
2.3
Exide Industries
Neutral
183
-
15,555
7,439
8,307
15.0
15.0
8.1
9.3
22.6
19.7
3.2
2.8
14.3
16.7
1.7
1.5
Apollo Tyres
Buy
187
235
9,531
12,877
14,504
14.3
13.9
21.4
23.0
8.7
8.1
1.4
1.2
16.4
15.2
0.9
0.8
Ceat
Buy
1,192
1,450
4,823
7,524
8,624
13.0
12.7
131.1
144.3
9.1
8.3
1.7
1.4
19.8
18.6
0.7
0.6
JK Tyres
Neutral
117
-
2,646
7,455
8,056
15.0
15.0
21.8
24.5
5.4
4.8
1.1
0.9
22.8
21.3
0.5
0.4
Swaraj Engines
Neutral
1,345
-
1,670
660
810
15.2
16.4
54.5
72.8
24.7
18.5
7.7
7.0
31.5
39.2
2.3
1.9
Subros
Neutral
168
-
1,008
1,488
1,681
11.7
11.9
6.4
7.2
26.2
23.4
2.8
2.5
10.8
11.4
0.9
0.8
Indag Rubber
Neutral
182
-
477
286
326
19.8
16.8
11.7
13.3
15.6
13.6
2.6
2.5
17.8
17.1
1.3
1.2
Capital Goods
ACE
Neutral
47
-
462
709
814
4.1
4.6
1.4
2.1
33.4
22.2
1.4
1.3
4.4
6.0
0.8
0.7
BEML
Neutral
1,009
-
4,200
3,451
4,055
6.3
9.2
31.4
57.9
32.1
17.4
1.9
1.8
6.3
10.9
1.3
1.1
Bharat Electronics
Neutral
1,423
-
31,788
8,137
9,169
16.8
17.2
58.7
62.5
24.2
22.8
3.8
3.3
44.6
46.3
2.7
2.5
Stock Watch
January 04, 2017
Company Name
Reco
CMP
Target
Mkt Cap
Sales ( Čcr )
OPM(%)
EPS (Č)
PER(x)
P/BV(x)
RoE(%)
EV/Sales(x)
(Č)
Price ( Č)
( Č cr )
FY17E
FY18E
FY17E
FY18E
FY17E
FY18E
FY17E
FY18E
FY17E
FY18E
FY17E
FY18E
FY17E
FY18E
Capital Goods
Voltas
Buy
332
407
10,990
6,511
7,514
7.9
8.7
12.9
16.3
25.8
20.4
4.6
4.1
16.7
18.5
1.4
1.2
BGR Energy
Neutral
118
-
851
16,567
33,848
6.0
5.6
7.8
5.9
15.1
20.0
0.9
0.8
4.7
4.2
0.2
0.1
BHEL
Neutral
125
-
30,546
28,797
34,742
-
2.8
2.3
6.9
54.3
18.1
0.9
0.9
1.3
4.8
0.7
0.5
Blue Star
Buy
489
634
4,669
4,283
5,077
5.9
7.3
14.9
22.1
32.8
22.1
6.4
5.4
20.4
26.4
1.1
0.9
Crompton Greaves
Neutral
61
-
3,811
5,777
6,120
5.9
7.0
3.3
4.5
18.4
13.5
0.8
0.8
4.4
5.9
0.6
0.5
Greaves Cotton
Neutral
125
-
3,043
1,755
1,881
16.8
16.9
7.8
8.5
16.0
14.7
3.2
3.0
20.6
20.9
1.4
1.3
Inox Wind
Neutral
187
-
4,141
5,605
6,267
15.7
16.4
24.8
30.0
7.5
6.2
2.1
1.5
25.9
24.4
0.8
0.7
KEC International
Neutral
143
-
3,670
9,294
10,186
7.9
8.1
9.9
11.9
14.4
12.0
2.1
1.8
15.6
16.3
0.6
0.6
Thermax
Neutral
771
-
9,191
5,421
5,940
7.3
7.3
25.7
30.2
30.0
25.5
3.6
3.3
12.2
13.1
1.5
1.4
VATech Wabag
Buy
480
681
2,617
3,136
3,845
8.9
9.1
26.0
35.9
18.5
13.4
2.3
2.0
13.4
15.9
0.7
0.6
Cement
ACC
Neutral
1,344
-
25,240
11,225
13,172
13.2
16.9
44.5
75.5
30.2
17.8
2.9
2.6
11.2
14.2
2.3
1.9
Ambuja Cements
Neutral
215
-
42,681
9,350
10,979
18.2
22.5
5.8
9.5
37.1
22.6
3.1
2.8
10.2
12.5
4.6
3.9
India Cements
Neutral
123
-
3,766
4,364
4,997
18.5
19.2
7.9
11.3
15.5
10.9
1.1
1.1
8.0
8.5
1.6
1.4
JK Cement
Neutral
731
-
5,107
4,398
5,173
15.5
17.5
31.2
55.5
23.4
13.2
2.8
2.4
12.0
15.5
1.7
1.4
J K Lakshmi Cement
Buy
365
565
4,290
2,913
3,412
14.5
19.5
7.5
22.5
48.6
16.2
3.0
2.5
12.5
18.0
2.1
1.7
Orient Cement
Buy
128
215
2,629
2,114
2,558
18.5
20.5
8.1
11.3
15.9
11.4
2.3
2.0
9.0
14.0
1.9
1.4
UltraTech Cement
Neutral
3,328
-
91,333
25,768
30,385
21.0
23.5
111.0
160.0
30.0
20.8
3.8
3.3
13.5
15.8
3.7
3.1
Construction
ITNL
Neutral
111
-
3,661
8,946
10,017
31.0
31.6
8.1
9.1
13.7
12.2
0.5
0.5
4.2
5.0
3.7
3.4
KNR Constructions
Neutral
170
-
2,383
1,385
1,673
14.7
14.0
41.2
48.5
4.1
3.5
0.8
0.7
14.9
15.2
1.8
1.5
Larsen & Toubro
Buy
1,368
1,634
127,590
111,017
124,908
11.0
11.0
61.1
66.7
22.4
20.5
2.7
2.5
13.1
12.9
2.2
2.0
Gujarat Pipavav Port
Neutral
133
-
6,439
705
788
52.2
51.7
5.0
5.6
26.6
23.8
2.6
2.4
11.2
11.2
8.7
7.3
Nagarjuna Const.
Neutral
84
-
4,667
8,842
9,775
9.1
8.8
5.3
6.4
15.8
13.1
1.3
1.2
8.2
9.1
0.7
0.6
PNC Infratech
Buy
105
143
2,691
2,350
2,904
13.1
13.2
9.0
8.8
11.7
11.9
0.4
0.4
15.9
13.9
1.3
1.0
Simplex Infra
Neutral
285
-
1,409
6,829
7,954
10.5
10.5
31.4
37.4
9.1
7.6
0.9
0.9
9.9
13.4
0.6
0.5
Power Mech Projects
Neutral
447
-
657
1,801
2,219
12.7
14.6
72.1
113.9
6.2
3.9
1.1
1.0
16.8
11.9
0.4
0.3
Sadbhav Engineering
Accumulate
275
298
4,710
3,598
4,140
10.3
10.6
9.0
11.9
30.5
23.1
3.2
2.8
9.9
11.9
1.6
1.4
NBCC
Neutral
254
-
15,267
7,428
9,549
7.9
8.6
8.2
11.0
31.0
23.1
1.5
1.2
28.2
28.7
1.8
1.3
MEP Infra
Neutral
38
-
611
1,877
1,943
30.6
29.8
3.0
4.2
12.5
9.0
6.1
4.1
0.6
0.6
1.7
1.5
SIPL
Neutral
96
-
3,385
1,036
1,252
65.5
66.2
(8.4)
(5.6)
3.6
4.1
(22.8)
(15.9)
11.5
9.6
Stock Watch
January 04, 2017
Company Name
Reco
CMP
Target
Mkt Cap
Sales ( Čcr )
OPM(%)
EPS (Č)
PER(x)
P/BV(x)
RoE(%)
EV/Sales(x)
(Č)
Price ( Č)
( Č cr )
FY17E
FY18E
FY17E
FY18E
FY17E
FY18E
FY17E
FY18E
FY17E
FY18E
FY17E
FY18E
FY17E
FY18E
Construction
Engineers India
Neutral
155
-
10,425
1,725
1,935
16.0
19.1
11.4
13.9
13.6
11.1
1.9
1.8
13.4
15.3
4.9
4.4
Financials
Axis Bank
Buy
455
630
108,851
46,932
53,575
3.5
3.4
32.4
44.6
14.1
10.2
1.8
1.6
13.6
16.5
-
-
Bank of Baroda
Neutral
149
-
34,309
19,980
23,178
1.8
1.8
11.5
17.3
13.0
8.6
1.5
1.2
8.3
10.1
-
-
Canara Bank
Neutral
265
-
14,381
15,225
16,836
1.8
1.8
14.5
28.0
18.3
9.5
1.3
1.0
5.8
8.5
-
-
Dewan Housing Finance Buy
246
350
7,697
2,225
2,688
2.9
2.9
29.7
34.6
8.3
7.1
1.3
1.1
16.1
16.8
-
-
Equitas Holdings
Buy
149
235
5,009
939
1,281
11.7
11.5
5.8
8.2
25.8
18.2
2.2
2.0
10.9
11.5
-
-
Federal Bank
Neutral
66
-
11,391
9,353
10,623
2.9
2.9
4.4
5.8
15.1
11.4
1.4
1.3
9.5
11.0
-
-
HDFC
Neutral
1,215
-
192,605
11,475
13,450
3.4
3.4
45.3
52.5
26.8
23.2
5.2
4.6
20.2
20.5
-
-
HDFC Bank
Accumulate
1,190
1,350
303,909
46,097
55,433
4.5
4.5
58.4
68.0
20.4
17.5
3.6
3.0
18.8
18.6
-
-
ICICI Bank
Buy
254
315
148,015
42,800
44,686
3.1
3.3
18.0
21.9
14.1
11.6
1.9
1.8
11.1
12.3
-
-
Lakshmi Vilas Bank
Buy
140
174
2,515
3,339
3,799
2.7
2.8
11.0
14.0
12.7
10.0
1.3
1.2
11.2
12.7
-
-
LIC Housing Finance
Buy
531
630
26,785
3,712
4,293
2.6
2.5
39.0
46.0
13.6
11.5
2.6
2.2
19.9
20.1
-
-
Punjab Natl.Bank
Neutral
118
-
25,153
23,532
23,595
2.3
2.4
6.8
12.6
17.4
9.4
2.7
1.9
3.3
6.5
-
-
RBL Bank
Neutral
341
-
12,622
1,783
2,309
2.6
2.6
12.7
16.4
26.9
20.8
2.9
2.6
12.8
13.3
-
-
South Ind.Bank
Neutral
20
-
2,697
6,435
7,578
2.5
2.5
2.7
3.1
7.4
6.4
1.0
0.8
10.1
11.2
-
-
St Bk of India
Neutral
245
-
190,072
88,650
98,335
2.6
2.6
13.5
18.8
18.1
13.0
1.7
1.5
7.0
8.5
-
-
Union Bank
Neutral
126
-
8,672
13,450
14,925
2.3
2.3
25.5
34.5
5.0
3.7
0.7
0.6
7.5
10.2
-
-
Yes Bank
Neutral
1,163
-
49,181
8,978
11,281
3.3
3.4
74.0
90.0
15.7
12.9
3.0
2.5
17.0
17.2
-
-
FMCG
Asian Paints
Neutral
899
-
86,189
17,128
18,978
16.8
16.4
19.1
20.7
47.0
43.4
16.4
15.4
34.8
35.5
5.0
4.5
Britannia
Buy
2,871
3,626
34,456
9,594
11,011
14.6
14.9
80.3
94.0
35.8
30.6
14.7
11.4
41.2
-
3.5
3.0
Colgate
Accumulate
897
995
24,408
4,605
5,149
23.4
23.4
23.8
26.9
37.7
33.4
20.9
16.3
64.8
66.8
5.3
4.7
Dabur India
Accumulate
275
304
48,503
8,315
9,405
19.8
20.7
8.1
9.2
34.0
29.9
9.5
7.8
31.6
31.0
5.5
4.9
GlaxoSmith Con*
Neutral
5,090
-
21,408
4,350
4,823
21.2
21.4
179.2
196.5
28.4
25.9
7.5
6.4
27.1
26.8
4.3
3.8
Godrej Consumer
Neutral
1,533
-
52,216
10,235
11,428
18.4
18.6
41.1
44.2
37.3
34.7
8.3
7.0
24.9
24.8
5.1
4.5
HUL
Neutral
830
-
179,559
35,252
38,495
17.8
17.8
20.7
22.4
40.2
37.1
38.4
32.9
95.6
88.9
4.9
4.5
ITC
Buy
243
284
294,852
40,059
44,439
38.3
39.2
9.0
10.1
27.1
24.0
7.6
6.6
27.8
27.5
6.8
6.1
Marico
Buy
258
300
33,250
6,430
7,349
18.8
19.5
6.4
7.7
40.3
33.5
12.2
10.2
33.2
32.5
4.9
4.2
Nestle*
Neutral
6,054
-
58,374
10,073
11,807
20.7
21.5
124.8
154.2
48.5
39.3
19.9
17.9
34.8
36.7
5.5
4.7
Tata Global
Neutral
124
-
7,854
8,675
9,088
9.8
9.8
7.4
8.2
16.8
15.2
1.9
1.8
7.9
8.1
0.8
0.8
Stock Watch
January 04, 2017
Company Name
Reco
CMP
Target
Mkt Cap
Sales ( Čcr )
OPM(%)
EPS (Č)
PER(x)
P/BV(x)
RoE(%)
EV/Sales(x)
(Č)
Price ( Č)
( Č cr )
FY17E FY18E
FY17E
FY18E
FY17E
FY18E
FY17E
FY18E
FY17E
FY18E
FY17E
FY18E
FY17E
FY18E
FMCG
Procter & Gamble
Accumulate
6,936
7,369
22,514
2,939
3,342
23.2
23.0
146.2
163.7
47.4
42.4
106.2
101.9
25.3
23.5
7.3
6.3
Hygiene
IT
HCL Tech^
Buy
835
1,000
117,832
49,242
57,168
20.5
20.5
55.7
64.1
15.0
13.0
3.1
2.3
20.3
17.9
2.2
1.8
Infosys
Buy
995
1,249
228,466
68,350
77,326
27.0
27.0
62.5
69.4
15.9
14.3
3.4
3.1
21.3
21.6
2.8
2.4
TCS
Accumulate
2,369
2,620
466,696
119,025
133,308
27.6
27.6
131.2
145.5
18.1
16.3
5.9
5.4
32.4
33.1
3.7
3.2
Tech Mahindra
Buy
491
600
47,776
29,673
32,937
15.5
17.0
32.8
39.9
15.0
12.3
2.9
2.5
19.6
20.7
1.3
1.1
Wipro
Buy
468
590
113,643
55,440
60,430
18.1
18.1
35.9
39.9
13.0
11.7
2.3
2.1
19.0
19.3
1.8
1.6
Media
D B Corp
Neutral
369
-
6,789
2,297
2,590
27.4
28.2
21.0
23.4
17.6
15.8
4.1
3.6
23.7
23.1
2.7
2.3
HT Media
Neutral
74
-
1,713
2,693
2,991
12.6
12.9
7.9
9.0
9.3
8.2
0.8
0.7
7.8
8.3
0.2
0.1
Jagran Prakashan
Buy
180
225
5,894
2,355
2,635
28.0
28.0
10.8
12.5
16.7
14.4
3.6
3.1
21.7
21.7
2.5
2.2
Sun TV Network
Neutral
522
-
20,569
2,850
3,265
70.1
71.0
26.2
30.4
19.9
17.2
5.1
4.5
24.3
25.6
6.5
5.6
Hindustan Media
Neutral
270
-
1,979
1,016
1,138
24.3
25.2
27.3
30.1
9.9
9.0
1.9
1.7
16.2
15.8
1.3
1.1
Ventures
TV Today Network
Buy
288
385
1,717
637
743
27.5
27.5
18.4
21.4
15.7
13.5
2.7
2.3
17.4
17.2
2.1
1.7
Metals & Mining
Coal India
Neutral
305
-
189,512
84,638
94,297
21.4
22.3
24.5
27.1
12.5
11.3
5.2
4.9
42.6
46.0
1.7
1.5
Hind. Zinc
Neutral
259
-
109,563
14,252
18,465
55.9
48.3
15.8
21.5
16.4
12.1
2.7
2.3
17.0
20.7
7.7
5.9
Hindalco
Neutral
159
-
32,821
107,899
112,095
7.4
8.2
9.2
13.0
17.3
12.2
0.8
0.8
4.8
6.6
0.8
0.8
JSW Steel
Neutral
1,645
-
39,769
53,201
58,779
16.1
16.2
130.6
153.7
12.6
10.7
1.7
1.5
14.0
14.4
1.5
1.3
NMDC
Neutral
130
-
41,210
6,643
7,284
44.4
47.7
7.1
7.7
18.4
16.9
1.6
1.6
8.8
9.2
3.9
3.5
SAIL
Neutral
52
-
21,270
47,528
53,738
(0.7)
2.1
(1.9)
2.6
19.8
0.6
0.5
(1.6)
3.9
1.3
1.2
Vedanta
Neutral
220
-
65,120
71,744
81,944
19.2
21.7
13.4
20.1
16.4
10.9
1.4
1.3
8.4
11.3
1.3
1.0
Tata Steel
Neutral
403
-
39,155
121,374
121,856
7.2
8.4
18.6
34.3
21.7
11.8
1.4
1.2
6.1
10.1
1.0
0.9
Oil & Gas
Cairn India
Neutral
247
-
46,305
9,127
10,632
4.3
20.6
8.8
11.7
28.1
21.1
0.9
0.9
3.3
4.2
6.5
5.4
GAIL
Neutral
442
-
56,003
56,220
65,198
9.3
10.1
27.1
33.3
16.3
13.3
1.5
1.4
9.3
10.7
1.2
1.0
ONGC
Neutral
193
-
247,425
137,222
152,563
15.0
21.8
19.5
24.1
9.9
8.0
0.9
0.8
8.5
10.1
2.1
1.9
Indian Oil Corp
Neutral
345
-
167,650
373,359
428,656
5.9
5.5
54.0
59.3
6.4
5.8
1.0
0.9
16.0
15.6
0.6
0.5
Reliance Industries
Neutral
1,091
-
353,762
301,963
358,039
12.1
12.6
87.7
101.7
12.4
10.7
1.3
1.2
10.7
11.3
1.6
1.4
Pharmaceuticals
Alembic Pharma
Neutral
602
-
11,351
3,483
4,083
20.2
21.4
24.3
30.4
24.8
19.8
5.6
4.5
25.5
25.3
3.2
2.6
Alkem Laboratories Ltd
Buy
1,655
1,989
19,790
6,043
6,893
18.7
19.3
80.5
88.8
20.6
18.6
4.6
3.8
22.3
20.3
3.1
2.7
Aurobindo Pharma
Buy
673
877
39,356
15,720
18,078
23.7
23.7
41.4
47.3
16.3
14.2
4.2
3.3
29.6
26.1
2.7
2.4
Sanofi India*
Neutral
4,272
-
9,839
2,277
2,597
17.3
18.3
149.4
172.0
28.6
24.8
4.7
3.8
25.1
28.8
4.0
3.3
Stock Watch
January 04, 2017
Company Name
Reco
CMP
Target
Mkt Cap
Sales ( Čcr )
OPM(%)
EPS (Č)
PER(x)
P/BV(x)
RoE(%)
EV/Sales(x)
(Č)
Price ( Č)
( Č cr )
FY17E FY18E
FY17E
FY18E
FY17E
FY18E
FY17E
FY18E
FY17E
FY18E
FY17E
FY18E
FY17E
FY18E
Pharmaceuticals
Cadila Healthcare
Accumulate
356
400
36,394
10,429
12,318
22.6
22.0
16.9
19.2
21.0
18.5
5.4
4.3
28.5
25.7
3.5
2.9
Cipla
Reduce
574
490
46,184
15,378
18,089
17.4
18.4
21.6
27.2
26.6
21.1
3.4
3.0
13.7
15.2
3.2
2.6
Dr Reddy's
Neutral
3,078
-
50,988
16,043
18,119
20.8
22.4
112.4
142.9
27.4
21.5
3.7
3.2
14.1
15.9
3.2
2.8
Dishman Pharma
Neutral
230
-
3,715
1,718
1,890
22.7
22.8
9.5
11.3
24.2
20.4
2.3
2.1
10.1
10.9
2.5
2.2
GSK Pharma*
Neutral
2,740
-
23,209
3,000
3,312
15.4
20.6
46.5
60.8
58.9
45.1
14.2
14.1
26.3
30.6
7.4
6.8
Indoco Remedies
Reduce
264
240
2,433
1,112
1,289
16.2
18.2
11.6
16.0
22.8
16.5
3.6
3.1
17.0
20.1
2.3
1.9
Ipca labs
Buy
532
613
6,709
3,303
3,799
15.3
15.3
17.3
19.7
30.7
27.0
2.7
2.5
9.1
9.4
2.1
1.9
Lupin
Buy
1,506
1,809
67,975
15,912
18,644
26.4
26.7
58.1
69.3
25.9
21.7
5.0
4.1
21.4
20.9
4.3
3.6
Sun Pharma
Buy
636
847
152,590
31,129
35,258
32.0
32.9
30.2
35.3
21.1
18.0
3.4
2.8
20.0
20.1
4.5
3.7
Power
Tata Power
Neutral
76
-
20,461
36,916
39,557
17.4
27.1
5.1
6.3
14.8
12.0
1.3
1.2
9.0
10.3
1.6
1.4
NTPC
Neutral
166
-
136,504
86,605
95,545
17.5
20.8
11.8
13.4
14.0
12.4
1.4
1.3
10.5
11.1
2.9
2.9
Power Grid
Buy
188
223
98,354
25,315
29,193
88.2
88.7
14.2
17.2
13.3
11.0
2.0
1.8
15.2
16.1
8.4
7.6
Real Estate
MLIFE
Buy
358
522
1,468
1,152
1,300
22.7
24.6
29.9
35.8
12.0
10.0
0.9
0.8
7.6
8.6
2.0
1.7
Telecom
Bharti Airtel
Neutral
304
-
121,381
105,086
114,808
34.5
34.7
12.2
16.4
24.9
18.5
1.7
1.6
6.8
8.4
2.1
1.8
Idea Cellular
Neutral
73
-
26,452
40,133
43,731
37.2
37.1
6.4
6.5
11.5
11.3
1.0
0.9
8.2
7.6
1.7
1.4
zOthers
Abbott India
Neutral
4,644
-
9,869
3,153
3,583
14.1
14.4
152.2
182.7
30.5
25.4
149.8
127.9
25.6
26.1
2.9
2.5
Bajaj Electricals
Buy
226
274
2,289
4,801
5,351
5.7
6.2
10.4
13.7
21.7
16.5
2.7
2.4
12.4
14.5
0.5
0.4
Finolex Cables
Neutral
412
-
6,294
2,883
3,115
12.0
12.1
14.2
18.6
29.0
22.1
15.4
13.5
15.8
14.6
1.8
1.7
Goodyear India*
Neutral
712
-
1,642
1,598
1,704
10.4
10.2
49.4
52.6
14.4
13.5
66.5
58.4
18.2
17.0
0.7
91.8
Hitachi
Neutral
1,358
-
3,693
2,081
2,433
8.8
8.9
33.4
39.9
40.7
34.0
32.8
27.3
22.1
21.4
1.8
1.5
Jyothy Laboratories
Neutral
337
-
6,123
1,440
2,052
11.5
13.0
8.5
10.0
39.7
33.7
9.6
8.9
18.6
19.3
4.5
3.2
Page Industries
Neutral
13,727
-
15,311
2,450
3,124
20.1
17.6
299.0
310.0
45.9
44.3
305.7
233.4
47.1
87.5
6.4
5.0
Relaxo Footwears
Neutral
397
-
4,770
2,085
2,469
9.2
8.2
7.6
8.0
52.5
50.0
20.4
17.4
17.9
18.8
2.4
2.1
Siyaram Silk Mills
Accumulate
1,324
1,605
1,241
1,733
1,948
11.6
11.7
96.6
114.7
13.7
11.6
2.1
1.8
15.3
15.7
0.9
0.8
Styrolution ABS India*
Neutral
600
-
1,055
1,440
1,537
9.2
9.0
40.6
42.6
14.8
14.1
37.7
34.3
12.3
11.6
0.7
0.6
TVS Srichakra
Neutral
3,378
-
2,587
2,304
2,614
13.7
13.8
231.1
266.6
14.6
12.7
379.6
298.9
33.9
29.3
1.1
0.9
HSIL
Neutral
282
-
2,037
2,384
2,515
15.8
16.3
15.3
19.4
18.4
14.5
18.3
15.7
7.8
9.3
1.0
0.9
Kirloskar Engines India
Neutral
322
-
4,659
2,554
2,800
9.9
10.0
10.5
12.1
30.7
26.6
12.8
12.1
10.7
11.7
1.5
1.3
Ltd
M M Forgings
Neutral
440
-
531
546
608
20.4
20.7
41.3
48.7
10.7
9.0
60.2
53.3
16.6
17.0
0.8
0.7
Stock Watch
January 04, 2017
Company Name
Reco
CMP
Target
Mkt Cap
Sales ( Čcr )
OPM(%)
EPS (Č)
PER(x)
P/BV(x)
RoE(%)
EV/Sales(x)
(Č)
Price ( Č)
( Č cr )
FY17E
FY18E
FY17E
FY18E
FY17E
FY18E
FY17E
FY18E
FY17E
FY18E
FY17E
FY18E
FY17E
FY18E
zOthers
Banco Products (India) Neutral
194
-
1,387
1,353
1,471
12.3
12.4
14.5
16.3
13.4
11.9
18.5
16.7
14.5
14.6
0.9
101.2
Competent Automobiles Neutral
162
-
99
1,137
1,256
3.1
2.7
28.0
23.6
5.8
6.9
31.1
28.1
14.3
11.5
0.1
0.1
Nilkamal
Neutral
1,441
-
2,150
1,995
2,165
10.7
10.4
69.8
80.6
20.7
17.9
82.4
71.5
16.6
16.5
1.0
0.9
Visaka Industries
Neutral
195
-
309
1,051
1,138
10.3
10.4
21.0
23.1
9.3
8.4
25.0
23.4
9.0
9.2
0.6
0.5
Transport Corporation of
Neutral
157
-
1,200
2,671
2,911
8.5
8.8
13.9
15.7
11.3
10.0
1.5
1.4
13.7
13.8
0.5
0.5
India
Elecon Engineering
Neutral
57
-
640
1,482
1,660
13.7
14.5
3.9
5.8
14.6
9.8
3.4
3.2
7.8
10.9
0.7
0.7
Surya Roshni
Neutral
182
-
797
3,342
3,625
7.8
7.5
17.3
19.8
10.5
9.2
20.0
16.0
10.5
10.8
0.5
0.4
MT Educare
Neutral
120
-
479
366
417
17.7
18.2
9.4
10.8
12.9
11.1
2.9
2.5
22.2
22.3
1.2
1.0
Radico Khaitan
Buy
111
147
1,476
1,667
1,824
13.0
13.2
6.7
8.2
16.7
13.6
1.5
1.4
9.0
10.2
1.3
1.1
Garware Wall Ropes
Neutral
621
-
1,358
873
938
14.3
14.3
35.2
37.5
17.7
16.6
3.1
2.6
17.5
15.9
1.4
1.3
Wonderla Holidays
Neutral
340
-
1,920
287
355
38.0
40.0
11.3
14.2
30.1
23.9
4.3
3.8
21.4
23.9
6.4
5.2
Linc Pen & Plastics
Neutral
240
-
354
382
420
9.3
9.5
13.5
15.7
17.8
15.3
3.0
2.6
17.1
17.3
1.0
0.9
The Byke Hospitality
Neutral
167
-
671
287
384
20.5
20.5
7.6
10.7
22.0
15.6
4.6
3.7
20.7
23.5
2.3
1.7
Interglobe Aviation
Neutral
820
-
29,635
21,122
26,005
14.5
27.6
110.7
132.1
7.4
6.2
44.3
31.7
168.5
201.1
1.4
1.1
Coffee Day Enterprises
Neutral
199
-
4,098
2,964
3,260
20.5
21.2
4.7
8.0
-
24.9
2.3
2.1
5.5
8.5
1.8
1.6
Ltd
Navneet Education
Neutral
112
-
2,678
1,062
1,147
24.0
24.0
6.1
6.6
18.5
17.0
3.8
3.4
20.6
19.8
2.6
2.4
Navkar Corporation
Buy
170
265
2,429
369
561
42.9
42.3
7.2
11.5
23.6
14.8
1.7
1.6
7.4
10.5
7.5
4.9
UFO Moviez
Neutral
407
-
1,124
619
685
33.2
33.4
30.0
34.9
13.6
11.7
1.9
1.6
13.8
13.9
1.5
1.2
VRL Logistics
Neutral
262
-
2,394
1,902
2,119
16.7
16.6
14.6
16.8
18.0
15.6
4.0
3.5
21.9
22.2
1.4
1.2
Team Lease Serv.
Neutral
878
-
1,502
3,229
4,001
1.5
1.8
22.8
32.8
38.6
26.7
4.1
3.6
10.7
13.4
0.4
0.3
S H Kelkar & Co.
Neutral
305
-
4,413
1,036
1,160
15.1
15.0
6.1
7.2
50.0
42.5
5.3
4.9
10.7
11.5
4.1
3.7
Quick Heal
Neutral
261
-
1,827
408
495
27.3
27.0
7.7
8.8
33.7
29.7
3.1
3.1
9.3
10.6
3.6
3.0
Narayana Hrudaya
Neutral
339
-
6,928
1,873
2,166
11.5
11.7
2.6
4.0
128.2
85.5
7.9
7.1
6.1
8.3
3.8
3.3
Manpasand Bever.
Neutral
544
-
3,115
836
1,087
19.6
19.4
16.9
23.8
32.2
22.9
3.9
3.4
12.0
14.8
3.5
2.6
Parag Milk Foods
Neutral
261
-
2,197
1,919
2,231
9.3
9.6
9.5
12.9
27.7
20.2
4.3
3.5
15.5
17.5
1.3
1.1
Mirza International
Buy
89
107
1,076
987
1,106
18.0
18.0
6.5
7.6
13.7
11.7
2.2
1.9
15.9
15.7
1.3
1.1
Asian Granito
Buy
229
351
690
1,071
1,182
12.1
12.4
12.7
16.0
18.0
14.4
1.7
1.5
9.5
10.7
0.9
0.8
Source: Company, Angel Research; Note: *December year end; #September year end; &October year end; Price as on January 03, 2017
Market Outlook
January 04, 2017
Research Team Tel: 022 - 39357800
DISCLAIMER
Angel Broking Private Limited (hereinafter referred to as “Angel”) is a registered Member of National Stock Exchange of India Limited,
Bombay Stock Exchange Limited and Metropolitan Stock Exchange Limited. It is also registered as a Depository Participant with CDSL
and Portfolio Manager with SEBI. It also has registration with AMFI as a Mutual Fund Distributor. Angel Broking Private Limited is a
registered entity with SEBI for Research Analyst in terms of SEBI (Research Analyst) Regulations, 2014 vide registration number
INH000000164. Angel or its associates has not been debarred/ suspended by SEBI or any other regulatory authority for accessing
/dealing in securities Market. Angel or its associates/analyst has not received any compensation / managed or co-managed public
offering of securities of the company covered by Analyst during the past twelve months.
This document is solely for the personal information of the recipient, and must not be singularly used as the basis of any investment
decision. Nothing in this document should be construed as investment or financial advice. Each recipient of this document should make
such investigations as they deem necessary to arrive at an independent evaluation of an investment in the securities of the companies
referred to in this document (including the merits and risks involved), and should consult their own advisors to determine the merits and
risks of such an investment.
Reports based on technical and derivative analysis center on studying charts of a stock's price movement, outstanding positions and
trading volume, as opposed to focusing on a company's fundamentals and, as such, may not match with a report on a company's
fundamentals. Investors are advised to refer the Fundamental and Technical Research Reports available on our website to evaluate the
contrary view, if any.
The information in this document has been printed on the basis of publicly available information, internal data and other reliable
sources believed to be true, but we do not represent that it is accurate or complete and it should not be relied on as such, as this
document is for general guidance only. Angel Broking Pvt. Limited or any of its affiliates/ group companies shall not be in any way
responsible for any loss or damage that may arise to any person from any inadvertent error in the information contained in this report.
Angel Broking Pvt. Limited has not independently verified all the information contained within this document. Accordingly, we cannot
testify, nor make any representation or warranty, express or implied, to the accuracy, contents or data contained within this document.
While Angel Broking Pvt. Limited endeavors to update on a reasonable basis the information discussed in this material, there may be
regulatory, compliance, or other reasons that prevent us from doing so.
This document is being supplied to you solely for your information, and its contents, information or data may not be reproduced,
redistributed or passed on, directly or indirectly.
Neither Angel Broking Pvt. Limited, nor its directors, employees or affiliates shall be liable for any loss or damage that may arise from
or in connection with the use of this information.